Abstract
I wanted to know how well a few plain sentences about someone's listening, naming no artist, track or person, identify them. Each sentence states a share, rate or typical length against a round threshold. I made sentences from the first half of a ListenBrainz listener's history and asked a blind matcher to find the same person's second half among others. It took three pre-registered rounds on disjoint sets of listeners. Round 1 missed its bar and round 2 passed. For round 3 I chose the sentences jointly, by a closed-form expected lineup credit and a probability of still holding that allows for regression to the mean. On a third set, measured only after the method was frozen, three sentences found the right person in a lineup of five 68.8% of the time, short of the pre-registered 75%. The gain over round 2's rule on the same lineups, 7.2 points, matched exploration, and round 2's rule dropped on the new set too. Three sentences carry nearly enough bits to name one person when made, but fewer than 2 bits survive to the second half. Matching on the artists a person plays puts the right person first among 352 in 94% of cases.
1Introduction
The thing I wanted to know was whether a few plain sentences about how someone listens to music could be about that person and hardly anyone else. It came out of a failure in an earlier part of this project. I had estimated Big Five personality from what people write, and the estimates correlated with questionnaire scores at about r = 0.16. At that accuracy nearly everyone gets shown a score close to the middle. A result like that reads like a horoscope, and people accept horoscopes as personal. Forer (1949) gave 39 students the same sketch, assembled from horoscope columns, and they rated it an accurate description of themselves. So I turned the problem around and looked for things that are true of a person and of few others.
Statements like that bring their own worry. Sweeney (2000) estimated that ZIP code, sex and date of birth make 87% of the 1990 US population likely unique, and Golle (2006) found 63% on the 2000 census. Four spatio-temporal points single out 95% of people in phone location data and 90% in credit card records (de Montjoye et al. 2013; 2015). A handful of ratings re-identified Netflix Prize records (Narayanan and Shmatikov 2008), and the artists a Deezer user streamed in a year make 97% of them unique (Matrosova et al. 2024). If a sentence is true of its reader and of few others, and it stays true, it is a quasi-identifier. A product that prints "you meet at least 400 new artists a month" on a yearly summary card would want to know how much of the person it is giving away.
I ended up measuring both with one test. I make a few sentences from the first half of a person's listening history, and a matcher that sees only the sentences has to pick out the same person's second half. The sentences can only say what a product could print. Accuracy in a lineup of five tells me whether the sentences are about the person at all. Accuracy against everyone at once tells me how close they come to singling the person out. Horoscope sentences, true of most people, act as the control. I also varied the gap between the two stretches of history, up to a year, to see how long any of it lasts.
I expected this to take one round. It took three, each pre-registered before its people were measured, on three disjoint sets of ListenBrainz listeners. Round 1 missed its bar. Round 2 passed on new people. For round 3 I counted identity in bits and chose the sentences jointly. On a third set of new listeners its gain over round 2's rule held up and its absolute bar failed. Section 8 goes through what that says about how I set the bar.
2Related work
For music, Matrosova, Moussallam, Louail and Bodini (2024) found on Deezer that 90% of a million users are unique by their liked songs and 60% by liked artists, and that one month of streaming logs makes 95% of 50,000 users unique. Their fingerprints are items, measured within one period. Hirschprung and Leshman (2021) had about 150 undergraduates submit three songs each from a favourite playlist, and classmates matched people to songs with 80% to 100% accuracy. Calandrino et al. (2011) inferred individual transactions from recommender outputs, Last.fm among them. Large scrobble collections exist (Vigliensoni and Fujinaga 2017; LFM-1b, Schedl 2016), but neither dataset paper runs a re-identification test.
Behaviour without its items also identifies people. Olejnik, Castelluccia and Janc (2012) found 69% of 368,284 browsing histories unique and showed that category-level history fingerprints too. Sekara et al. (2021) re-identified 91.2% of 3.5 million people from four apps and found that app fingerprints drift slowly, and Oliveira et al. (2023) re-identified 80% of people across separate time slices from their most visited web domains. The closest design to mine is Creţu et al. (2022), who learn a profile from one week of who people call and message and match it to a later week. Among more than 40,000 people the right person comes first 52% of the time, and 24% are still identifiable after 20 weeks. Their profile is a learned embedding of an interaction graph. Rocher, Hendrickx and de Montjoye (2019) give a model for extending such results from a sample to a population. Eckersley (2010) reported browser fingerprints in bits per attribute, which I took as the template for bits per sentence.
Listening changes over time. Spotify listeners explore in bursts with seasonal cycles (Mok, Way, Maystre and Anderson 2022), breaks in routine go with bursts of exploration (Kim, Askin and Evans 2024), and there are shared diurnal and seasonal patterns (Park et al. 2019). Anderson et al. (2021) linked Spotify listening to Big Five traits. None of these asks whether individual differences are stable enough to re-identify someone.
Picking attributes that single out one object among distractors is the referring-expression problem. Dale and Reiter (1995) showed that the shortest such description is NP-hard to find and proposed an incremental algorithm. Motwani and Xu cast the search for a small separating attribute set as set cover over pairs of records. Neither handles an attribute that stops being true. Radlinski et al. (2022) and Ramos et al. (2024) represent users as short natural-language profiles for scrutable recommendation. Sguerra et al. (2025) asked 64 Deezer employees to rate profiles generated from their own listening and from other users', and people rated their own higher, a lineup of sorts with the person as judge. Staab et al. (2024) showed that language models infer personal attributes from Reddit text with up to 85% top-1 accuracy. On the Barnum effect, Dickson and Kelly (1985) reviewed the evidence that people accept generic descriptions, and Suwanaposee et al. (2023) found no significant difference in perceived quality when 492 people saw identical movie recommendations labelled as personalised or not.
In a search on 5 November 2026 I found no paper that reports identification accuracy against the number of readable behavioural sentences, charges each sentence for whether it stays true, or uses a blind matcher as the Barnum control. The search was not exhaustive.
3Data
ListenBrainz publishes listening histories, many imported from Last.fm, through a public API. I found listeners by walking its similar-users graph from ten long-standing public accounts of the project's developers, expanding 40 users per round. An account qualified with 5,000 to 2,000,000 listens, at least 365 days between its first and latest listen, and a listen within 120 days of the walk. The first walk, on 26 October 2026, saw 1,477 accounts, checked 1,059 and qualified 631. I continued it with the same rules on 5 November until 817 had qualified for round 2, and then 1,300 for round 3. The walk follows taste, so the sample leans towards self-hosters, Last.fm veterans and listeners of Western rock, metal and electronic music.
I downloaded each account's most recent listens, up to 60,000, extending heavy listeners until two years or 150,000 listens were covered. Accounts are stored under a salted hash, and no username, artist or track appears in any committed file or in this paper. Cleaning removed duplicate scrobbles and excluded accounts with a collapsed bulk import, gaps faster than anyone listens, too many days of 500 or more listens, one track above 30% of listens, scripted pacing, or too little history. From round 2 on I also dropped accounts where one artist took over 75% of listens or with fewer than 50 artists; on round 1's people that removed one account, which played a single artist and nothing else. A person then needed 2,000 or more listens. I dropped the last 8 weeks of each history, which belong to other parts of the project, and required 1,000 listens before them and 200 inside them.
| set | used for | accounts downloaded | kept after cleaning | people |
|---|---|---|---|---|
| round 1 | round 1 test; round 3 exploration | 350 of 360 | 343 | 304 (303 after the single-artist rule) |
| round 2 | round 2 confirmation; round 3 exploration | 370 of 370 | 359 | 333 |
| round 3 | round 3 confirmation | 400 of 400 | 387 | 352 |
Each later set came from accounts no earlier download had started, so nobody is in two sets. Round 1's kept accounts hold 15,885,726 listens from February 2005 to October 2026, and the median account spans 1,561 days. I measured none of the third set's histories until the round 3 method was committed and pushed.
The data has no time zone, play length, skips, device, country or demographics. So no sentence uses the hour on someone's clock, the weekday, how long a track played or whether it was skipped. For the median account 81% of listens arrived more than a week after they were played, mostly through importers, so a history shows how a person logs as well as how they listen.
4Sentences and the lineup test
Each person's training weeks are cut at their midpoint in time into a first half and a second half , and is cut again into quarters and . A window reads the plays inside it and before it, never later ones. Sentences are always made from and checked on .
Every measure is a share, a rate per month or a typical length. Measures that would grow with the window, such as the longest streak, are taken per 13-week season or per 30 days and averaged. Round 1 had 34 families, grouped as discovery, loyalty, concentration, repetition, runs, clock, rhythm and sessions. Round 2 added 23 for 57 in all. Among the new ones are the share of plays to songs first heard in the four weeks before, the typical gap before a song comes back, the hours between sessions, and how long a listening day runs from first play to last.
Each family has a fixed grid of round thresholds and two sentences, one for "at least" and one for "no more than". A statement is a family , a direction and a threshold , and it is true of a window when ("at least") or ("no more than"). A value that cannot be measured makes it false. There are 2,654 statements. Two examples are "Your typical session runs 60 minutes or longer" and "No more than 7.5% of your plays go to artists you first heard in the four weeks before". Nothing about health, religion, sexuality or politics can be said, and no raw play count is ever a statement.
In a lineup, the target's sentences are made from their against the first halves of everyone outside the lineup, so the four decoys play no part in choosing them. The matcher counts how many of the sentences are true of each of the five second halves and picks the highest count. An -way tie that includes the target scores . Each person is a target in 20 lineups with decoys drawn at random, and accuracy is the mean over a target's lineups, then over targets. Chance is 20%. Intervals are percentile bootstraps over people with 4,000 resamples. The permutation null shuffles second halves across people 1,000 times, so its floor is .
The Barnum control runs the same lineups with horoscope sentences. For each family and direction I take the threshold true of the target and of between 50% and 90% of the reference that the target meets most surely, then the top by confidence.
Before each round's people were measured I committed and pushed its test, bar, seeds and code. The scripts refuse to make a confirmation run twice.
5Rounds 1 and 2
Round 1 kept a statement when it was true of the person and of at most 10% of the reference. It scored each by confidence times rarity. Rarity is the surprisal of the of reference people it also fits. Confidence is , sign flipped for "no more than", with the family's spread across the window's four quarters. The top three by score, at most two per group, went into the lineup. Before the run I had computed the family values on the 304 people once, only to check the threshold grids, and widened two of them. The bar was at least 60%, with the interval's lower end above 40% and . I expected the Barnum control at 30% or below.
It missed. Three statements found the person 54.9% of the time (50.7% to 58.9%). The interval and conditions held and the size didn't. Coverage was most of the problem. With the 10% line, 34 of the 304 targets had no qualifying statement in any lineup, and in 36% of lineups the target had fewer than three. Only 46.5% of first-half statements were still true on the second half. Afterwards, outside the pre-registration, I matched on all 34 family values at once and found the person 86.8% of the time (83.9% to 89.4%). So the two halves of a history were alike on readable measures, and the sentences were losing most of that. The Barnum control came in at 31.9%, above what I expected, because sentences that each fit most people still narrow a lineup once there are a few.
I built round 2 on round 1's people, 303 after the single-artist rule, and recorded every step with its score. The round 1 rule scored 55.1% on them. Going to 57 families raised it to 57.9%, weighting each family by its split-half correlation squared to 59.5%, falling back to 15% and 20% lines for people with nothing under 10% to 62.4%, cubing the confidence to 64.6%, and a 20% line to 68.9%. Round 2 also kept one statement per family. On the people it was built on it scored 69.7% (66.0% to 73.2%). I pre-registered it for 333 new people with a bar of 60% and a lower interval end above 50%.
It passed at 67.5% (63.8% to 71.0%), about two points under its in-sample figure.
| test | round 1, 304 people | round 2, 333 new people |
|---|---|---|
| 3 statements (primary) | 54.9% (50.7% to 58.9%) | 67.5% (63.8% to 71.0%) |
| 5 statements | 57.6% (53.3% to 61.8%) | 71.5% (68.0% to 74.8%) |
| Barnum, 3 statements | 31.9% (30.7% to 33.2%) | 31.7% (30.3% to 33.0%) |
| Barnum, 5 statements | 38.3% (36.7% to 39.8%) | 38.7% (37.0% to 40.5%) |
| fingerprint, all families | 86.8% (34 families, not pre-registered) | 89.5% (57 families, bar 75%) |
Every sentence test had a shuffled mean of 20.0% or 20.1% and . In round 2 the target had fewer than three statements in only 1.3% of lineups.
Part of the pass came from widening "only you" from a tenth of listeners to a fifth; on whole histories only 39% of card statements fit 10% or fewer of the others. Round 2 told me the sentences were about the person. It couldn't tell me whether they single someone out in a crowd, since a lineup of five can show at most bits. That was the question for round 3.
6Round 3 method
6.1 Bits
Against a reference of other people, of whom fit every statement in a set , the set carries
bits. The half count is the Krichevsky and Trofimov estimate, so a set nobody else fits is worth bits, 10.3 for . Picking one person out of takes bits, 9.3 for . If the statements were independent across people their bits would add, , and the gap between and shows how much the sentences repeat each other. A set's surviving bits are computed on the others' second halves when the person's own second half still fits all of , and zero when it does not.
6.2 How likely a sentence is to hold
Every value becomes a normal score , with its mid-rank percentile among the population's values on the same kind of window. For each family, is the correlation across people of with , clipped to . A person's score is their own level plus window noise, with . Their noise variance starts from the family's and is moved towards what their own two quarters show,
Given , the next window's score has mean and variance
and the chance that a sentence true on is still true is
with for "at least", for "no more than", and the normal score of a value equal to the threshold. The factor pulls extreme people back towards the middle. Only , and enter.
6.3 Choosing sentences together
Rounds 1 and 2 scored each statement on its own. For round 3 I wanted the set that does best as a set. Model the target's count in a lineup as a sum of independent Bernoulli(), and each decoy as a draw from the reference population, reference person counting sentence with their own . Let be the target's count distribution, and and the chance that a decoy counts fewer than and exactly . With decoys the expected credit of is
and when . The fraction is , the expected tie share summed in closed form over the number of decoys that tie. The code's tests check it against brute-force enumeration.
Selection is greedy. Starting from nothing, I add the true statement that most raises the credit, with at most one per family and two per group, until there are . Ties go to the rarer statement, then the surer one, and after the first step only the 200 statements that do best alone are considered. In a lineup of five and the reference is everyone outside the lineup. For 1 of the same rule runs with against everyone else.
A threshold the target only just clears has a low , so the rule tends to take a blunter one the target clears comfortably. A statement that repeats one already chosen adds little credit, so overlapping statements don't get stacked. The greedy step is close in spirit to Dale and Reiter and to Motwani and Xu, but the credit is not a coverage function and I don't claim their guarantee for it.
6.4 Other matchers and tests
In 1 of , a person's sentences are counted on all second halves. The rank of their own second half, ties broken at random in expectation, gives top-1 accuracy, and the rank bits say how much of the needed the matcher recovered.
A fingerprint compares all 57 measures at once. Round 2's version is the mean absolute difference of percentiles. The learned version puts each value on the normal-score scale of the first halves (an unmeasurable value counts as 0) and uses
where and hold the people's scores on and , with eigenvalues floored at a thousandth of the mean variance. No second half is used to learn . I also report a diagonal version and plain Euclidean distance.
The item baseline is the one the literature uses. Each half becomes the vector of square roots of its artist play shares , and two halves are compared by the Hellinger affinity . It names artists, so no card could print it. I included it to see what readability costs.
For decay, window B is a person's last 26 training weeks and window A is 26 weeks ending 0, 1, 3, 6 or 12 months before B. Sentences and fingerprints are made on A and matched on B, using the same people at every gap.
7Round 3 exploration on the 636
Everything here was measured on the 636 people of rounds 1 and 2, all of whom I had already seen, with 20 lineups per person, seed 7, the same lineups for every method. These results set the round 3 bars.
7.1 What went wrong first
My first hold probability used each person's own quarter-to-quarter wobble with no pull to the middle. It was badly overconfident on rare statements, the ones that matter. Statements it gave a 90% chance of holding held about 70% of the time, because people at the edge of the population drift back towards it. Adding the pull fixed the calibration. I set and by calibrating against whether rare statements (true of 20% of others or fewer) still held on , and never tuned them on lineup accuracy. The log loss was 0.635, against 0.76 without the pull and 1.04 for round 2's confidence. On a subsample of 64 people the fix took joint selection from 69% to 76% on three sentences in a lineup of five (round 2's rule: 65%).
After that, other choices hardly moved the result. Any number of sentences per group gave 75.1%, allowing only statements true of half the others or fewer gave 75.2%, counting decoys by first-half truth instead of their hold probability gave 73.7%, and gave 75.3%. Round 2's 20% rarity line cost three points (72.5%), because it stopped the greedy step from pairing two moderately rare statements that are rare together. I kept no rarity line, at most two per group, and decoys counted by their hold probability.
7.2 What it found
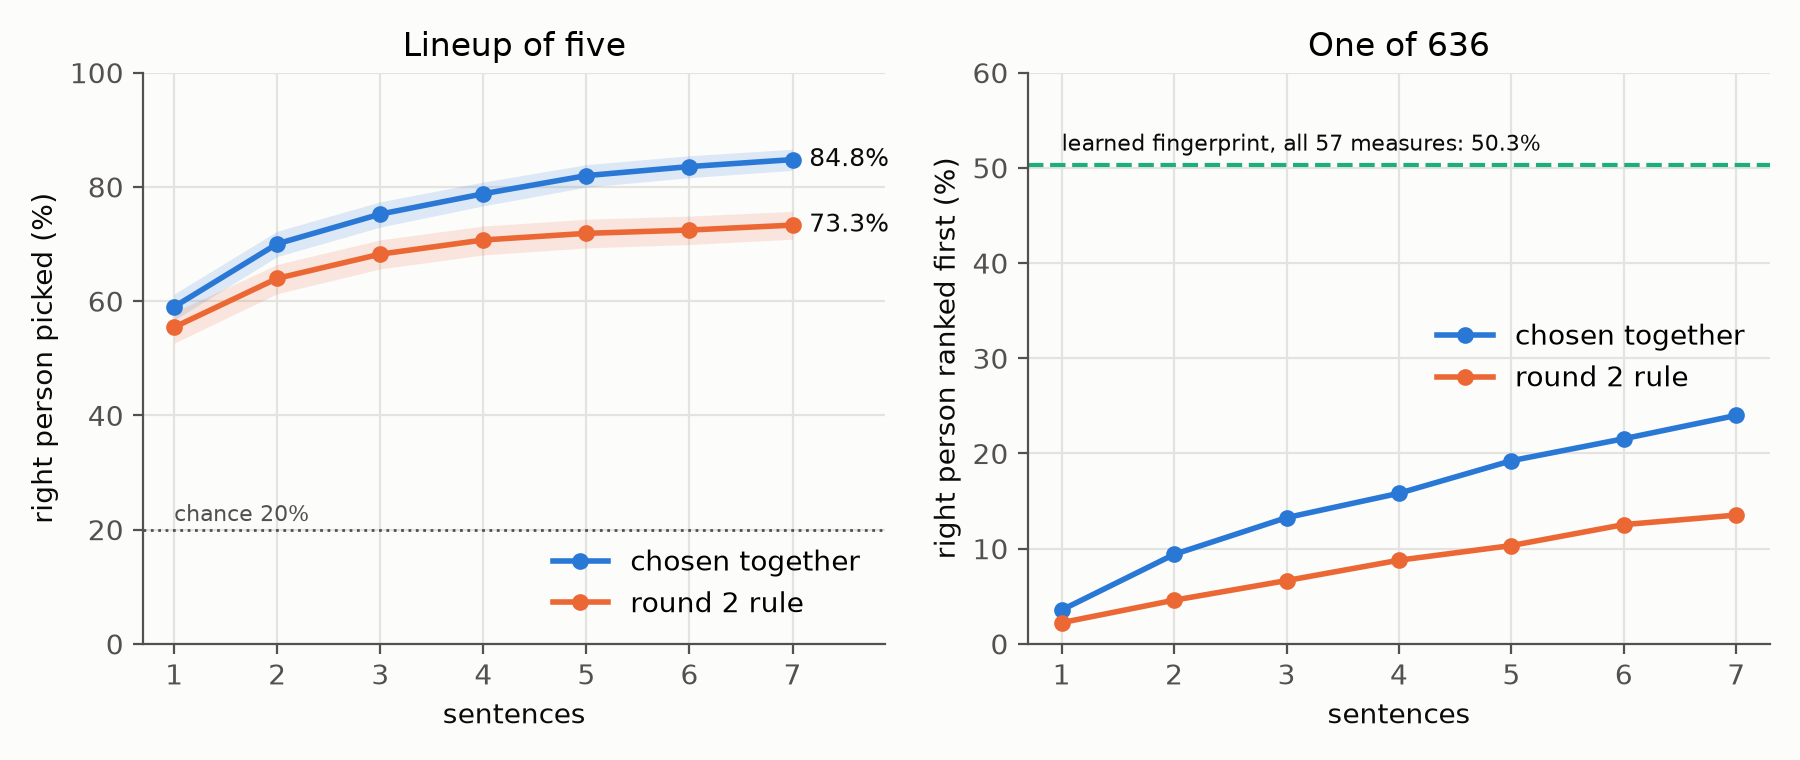
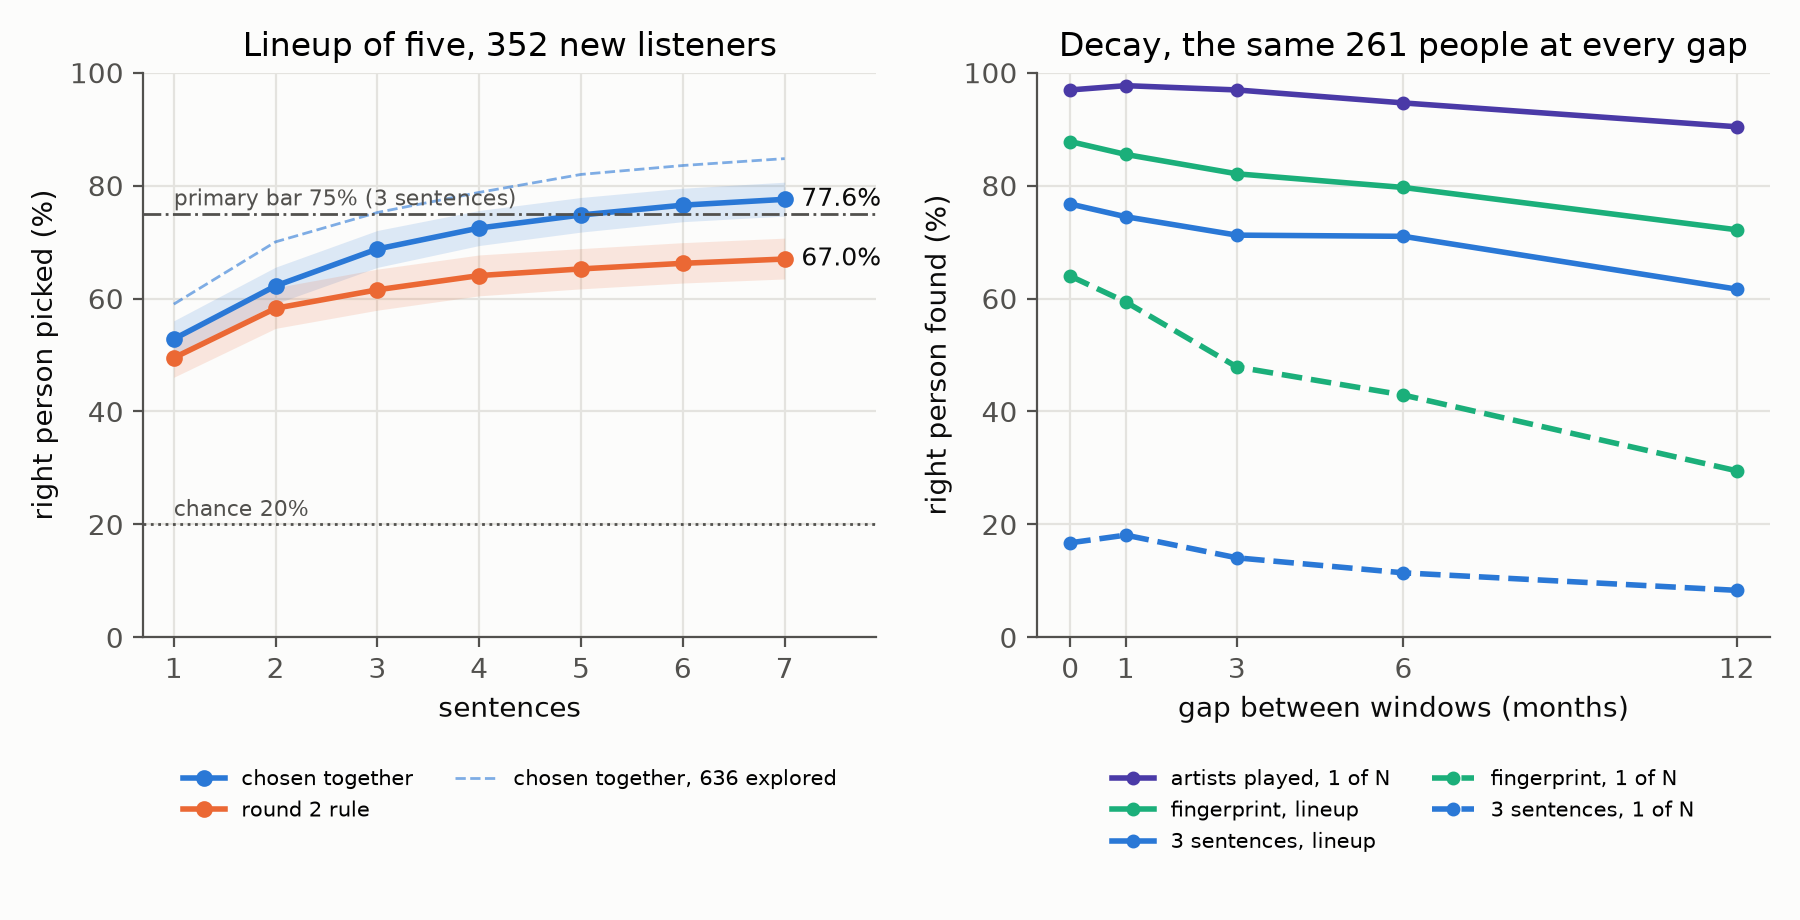
Three joint sentences found the person in a lineup of five 75.2% of the time (73.0% to 77.4%), against 68.2% for round 2's rule on the same lineups, a paired difference of 7.0 points (4.9 to 9.2). The gap grew with each sentence. At seven, joint selection reached 84.8% and round 2's rule 73.3%, partly because round 2's rule runs out of statements (12% of its lineups had fewer than seven) and partly because its later statements repeat the earlier ones (Figure A). The fingerprint over all 57 measures did better than any number of sentences, 89.8% with percentiles and 88.6% with the learned distance, and the artist fingerprint reached 99.1%.
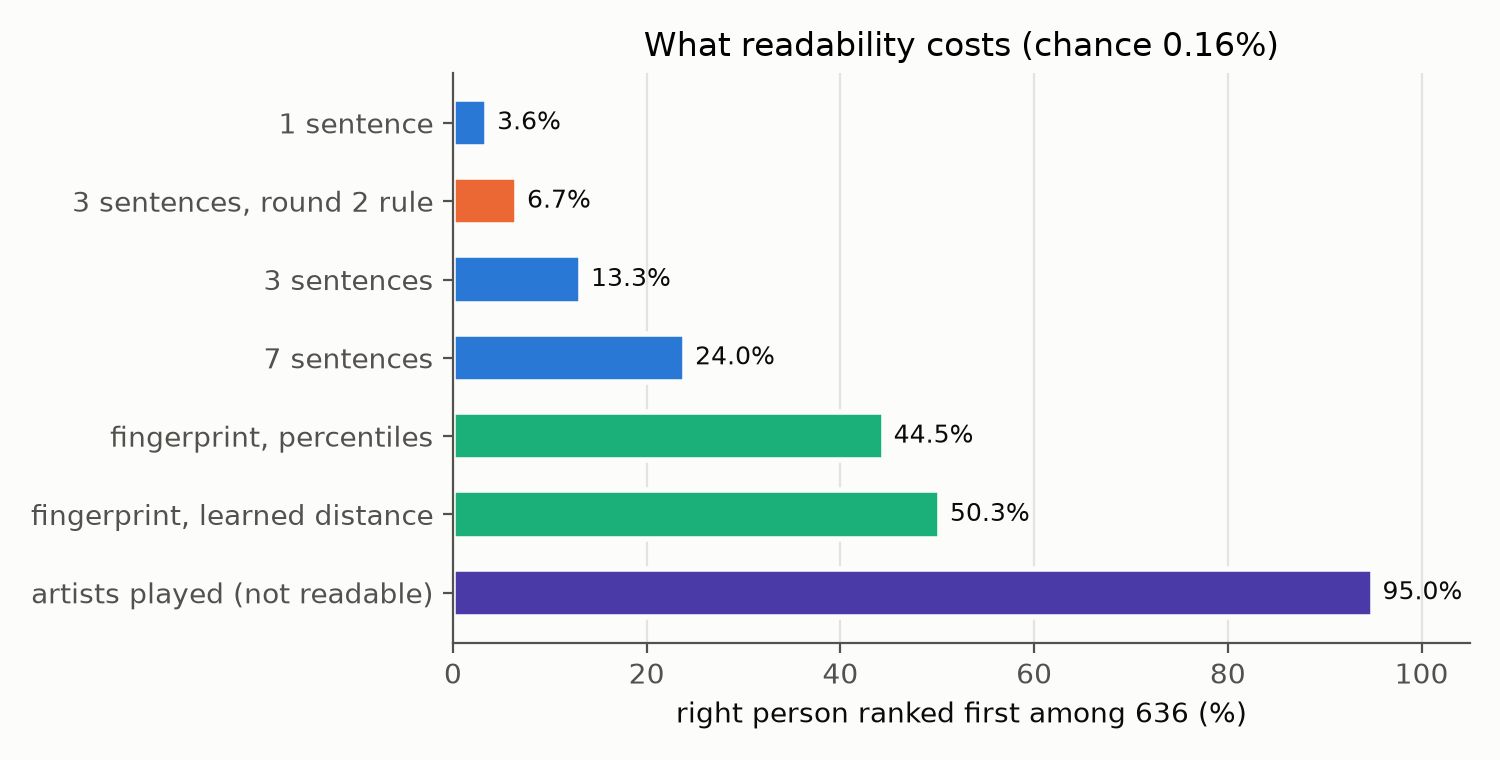
Against all 636 at once, where chance is 0.16%, three joint sentences ranked the right person first 13.3% of the time (11.0% to 15.7%) against 6.7% for round 2's three. The learned fingerprint reached 50.3% (46.4% to 54.4%), 5.8 points (2.2 to 9.4) above the percentile fingerprint. Noise weights alone gave 43.2% and plain Euclidean distance 40.3%, so the gain comes from counting correlated measures once. The artist list ranked the right person first 95.0% of the time (Figure B, section 8.4).
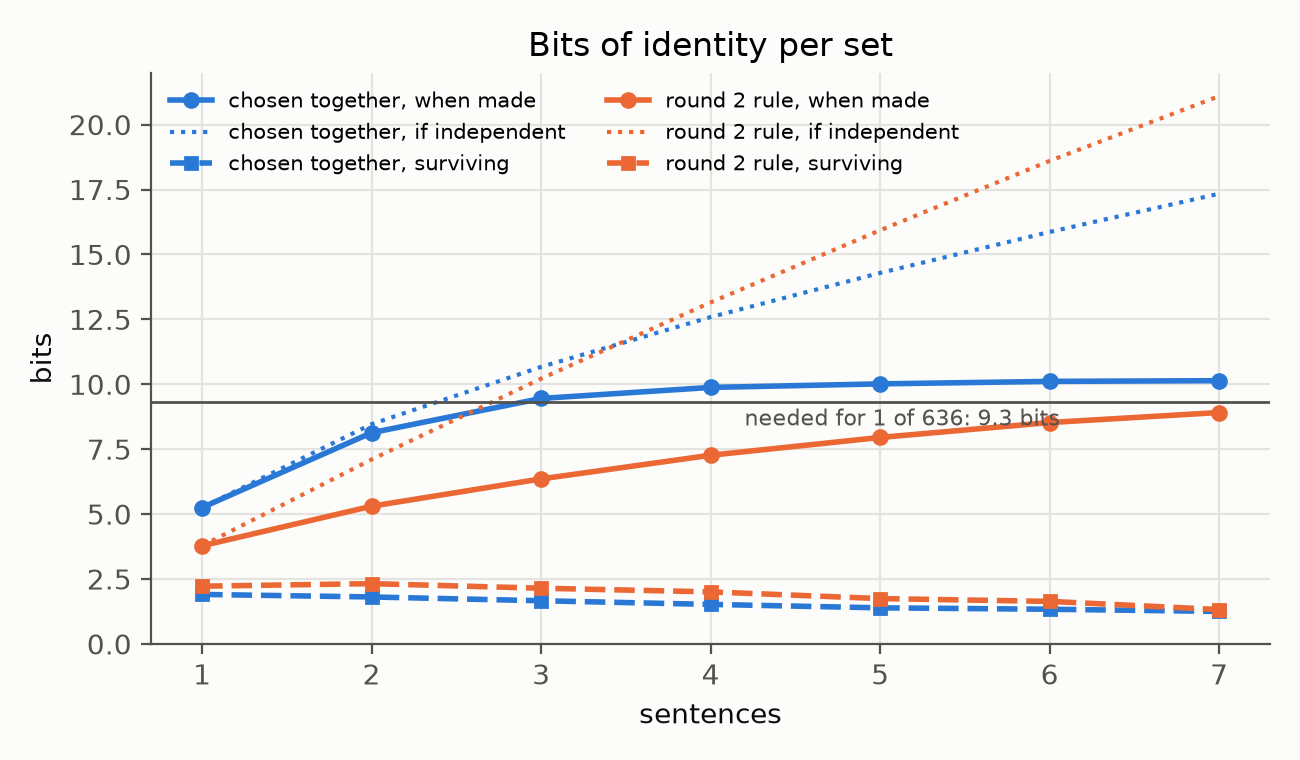
The bits were the part that surprised me. The best single true statement about a person fits a share of the others worth 5.5 bits on average. Chosen for 1 of 636, three joint sentences carry 9.5 bits, more than the 9.3 needed. On paper that is enough to name one person. Then I checked the second halves.
| k | joint bits | independence sum | joint kept on | joint surviving bits | round 2 bits | round 2 sum | round 2 kept | round 2 surviving bits |
|---|---|---|---|---|---|---|---|---|
| 1 | 5.3 | 5.3 | 42% | 1.9 | 3.8 | 3.8 | 63% | 2.2 |
| 2 | 8.1 | 8.5 | 25% | 1.8 | 5.3 | 7.1 | 49% | 2.3 |
| 3 | 9.5 | 10.7 | 19% | 1.7 | 6.4 | 10.2 | 38% | 2.1 |
| 5 | 10.0 | 14.3 | 15% | 1.4 | 8.0 | 15.9 | 25% | 1.7 |
| 7 | 10.1 | 17.3 | 13% | 1.2 | 8.9 | 21.1 | 17% | 1.3 |
Only 19% of people still fit all three of their joint sentences on the second half, and the surviving bits average 1.7. Round 2's three carry 6.4 bits against an independence sum of 10.2, so almost 4 of their bits are the same information said twice; joint selection loses about 1.2, some of it to the ceiling of the estimate (Figure D). Round 2's blunter sentences keep better, and the surviving bits of the two rules end up close. Surviving bits are all or nothing, though, and the counting matcher gives partial credit for two sentences out of three, which is how 13.3% top-1 is possible on 1.7 surviving bits.
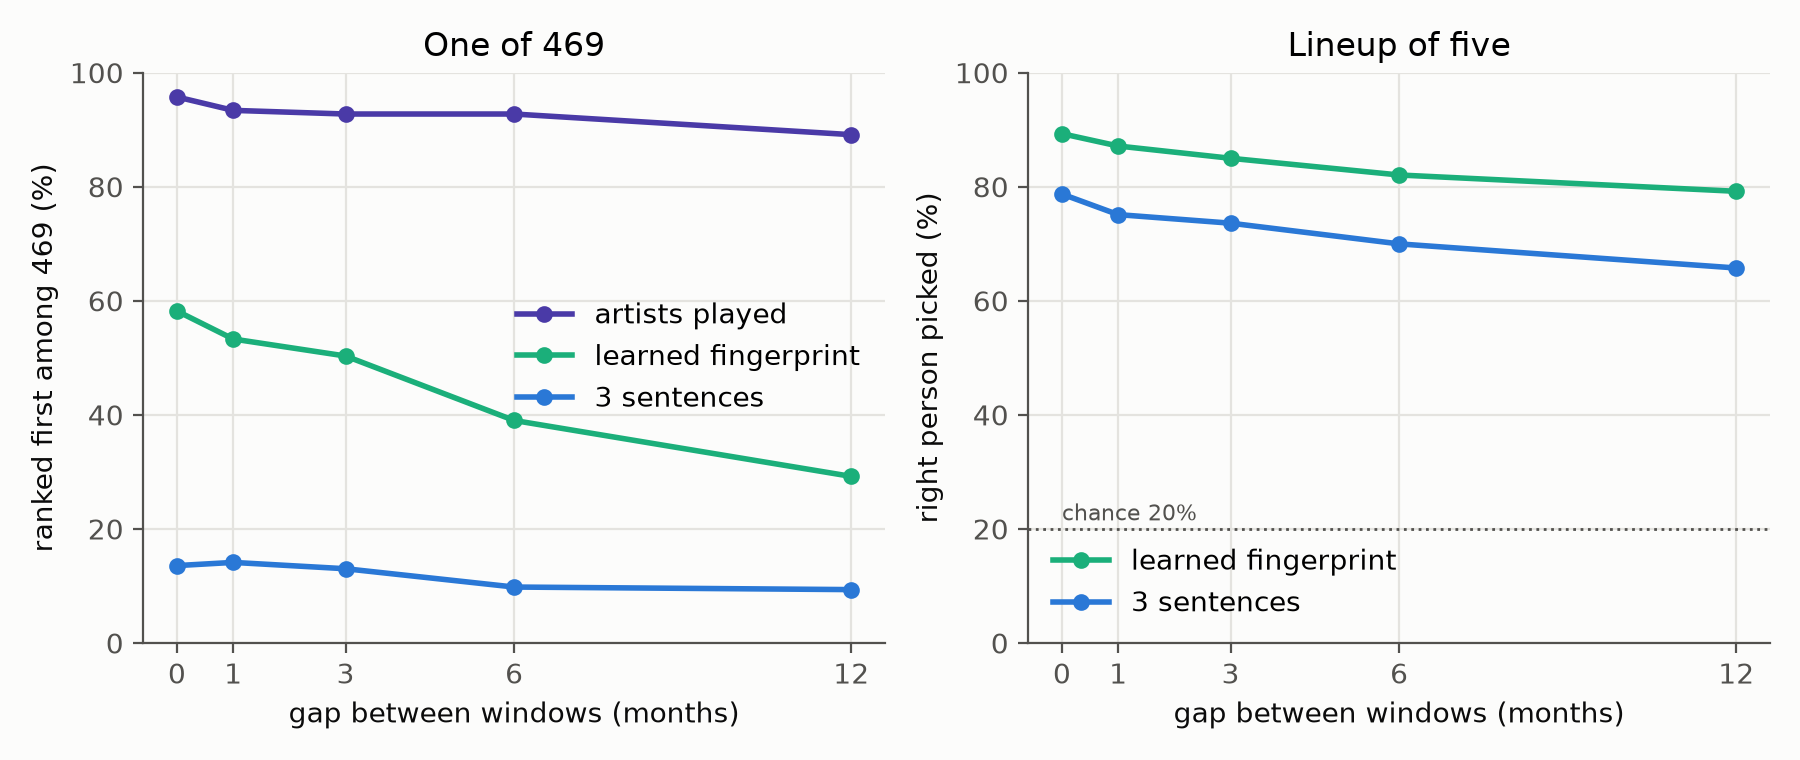
Over a year, on the 469 people with enough history, the behavioural measures faded faster than the artists (Figure C; table in section 8.5). The learned fingerprint's top-1 halved, from 58.2% to 29.2%. Three sentences lost about 13 points in a lineup, and their top-1 went from 13.6% to 9.4%.
8Confirmation on the third set
8.1 What I froze
I committed and pushed the pre-registration before measuring any third-set listener. It froze the rule as described above (, , clipped to , two per group, a pool of 200, no rarity line) and the learned fingerprint with a ridge of a thousandth. Population quantities (, , normal scores, rarity counts) are recomputed on the third set from first halves and their quarters only. Lineups are 20 per person, seed 7.
The primary test was three joint sentences in a lineup of five, passing at 75% or more with the lower interval end above 67.5% (round 2's confirmed figure) and . The 75% sat at the exploration estimate, so I knew a pass on the point estimate was close to a coin toss, and I treated the interval condition as the part that should hold. The three secondary tests are in the table below; everything else had no bar.
The third set had 352 people, none in an earlier set. Picking one out of 352 needs 8.5 bits.
8.2 The primary test failed
Three joint sentences found the person 68.8% of the time (65.5% to 72.1%), shuffled mean 20.0%, . Only the condition held. On the 636 the same rule had scored 75.2%, so it lost 6.4 points on new people.
| test (third set, 352 people) | result | 95% interval | bar | verdict |
|---|---|---|---|---|
| 3 joint sentences, lineup of 5 (primary) | 68.8% | 65.5% to 72.1% | at least 75%, lower end above 67.5%, | failed |
| (1) learned fingerprint, 1 of 352, top-1 | 42.3% | 36.9% to 47.4% | at least 40% | |
| (1) learned minus percentile fingerprint, top-1 | +4.5 points | -0.003 to 9.1 | lower end above 0 | failed |
| (2) 3 joint sentences, 1 of 352, top-1 | 13.6% | 10.6% to 16.8% | at least 10% | |
| (2) joint minus round 2 rule, top-1 | +5.1 points | 2.5 to 7.7 | lower end above 0 | passed |
| (3) joint minus round 2 rule, lineup of 5 | +7.2 points | 4.2 to 10.4 | lower end above 0 | passed |
Secondary test 1 failed by the smallest margin the bootstrap could show, a lower end 0.003 points below zero. The learned distance was better by about as much as on the 636, and this sample can't rule out no gain.
8.3 Joint against one at a time
Funny enough, the clearest explanation of the failure came from the old rule. Round 2's rule, unchanged since round 2, scored 61.5% (57.9% to 65.2%) on the same 352 people and lineups, six points below the 67.5% it was confirmed at on round 2's own new listeners. From the 636 to the third set, the joint rule dropped 6.4 points and round 2's rule 6.7. The paired difference held at 7.2 points (4.2 to 10.4), against 7.0 in exploration.
| sentences | joint, 636 | round 2 rule, 636 | joint, 352 | round 2 rule, 352 |
|---|---|---|---|---|
| 1 | 59.0% | 55.4% | 52.8% | 49.5% |
| 2 | 70.0% | 64.0% | 62.2% | 58.3% |
| 3 | 75.2% | 68.2% | 68.8% | 61.5% |
| 4 | 78.8% | 70.7% | 72.5% | 64.1% |
| 5 | 82.0% | 71.9% | 74.8% | 65.2% |
| 6 | 83.6% | 72.4% | 76.5% | 66.2% |
| 7 | 84.8% | 73.3% | 77.6% | 67.0% |
The curves have the same shape on both sets (Figure E, left). Two joint sentences on the third set (62.2%) did as well as round 2's three (61.5%).
8.4 One of N
| matcher | top-1, 636 | rank bits, 636 | top-1, 352 | rank bits, 352 |
|---|---|---|---|---|
| 1 joint sentence | 3.6% | 3.1 | 3.9% | 2.8 |
| 3 joint sentences | 13.3% | 4.6 | 13.6% | 4.1 |
| 3 sentences, round 2 rule | 6.7% | 4.5 | 8.4% | 3.9 |
| 7 joint sentences | 24.0% | 5.9 | 23.3% | 5.3 |
| fingerprint, percentiles | 44.5% | 7.2 | 37.8% | 6.2 |
| fingerprint, learned distance | 50.3% | 7.4 | 42.3% | 6.3 |
| artists, Hellinger | 95.0% | 9.1 | 94.0% | 8.2 |
Chance on the third set is 0.28%. Three joint sentences ranked the right person first 1.6 times as often as round 2's three. Since differs, rank bits are the fairer comparison across sets. The artist list recovered 8.2 of the 8.5 bits needed, the 57 measures 6.3 and three sentences 4.1, close to the 636's proportions.
8.5 Bits and decay
Three joint sentences carried 8.8 bits when made, against an independence sum of 10.4 and a ceiling of 9.5 for this . 19% of people kept all three on their second half, and 1.4 bits survived. Round 2's three carried 6.4 bits against a sum of 10.3, were kept whole by 29% of people, and kept 1.6 bits.
| gap | 3 sentences, lineup of 5 (explored / third) | learned fingerprint top-1 (explored / third) | artists top-1 (explored / third) |
|---|---|---|---|
| none | 78.7% / 76.7% | 58.2% / 64.0% | 95.7% / 96.9% |
| 1 month | 75.1% / 74.5% | 53.3% / 59.4% | 93.4% / 97.7% |
| 3 months | 73.6% / 71.2% | 50.3% / 47.9% | 92.8% / 96.9% |
| 6 months | 70.0% / 71.0% | 39.0% / 42.9% | 92.8% / 94.6% |
| 12 months | 65.8% / 61.7% | 29.2% / 29.5% | 89.1% / 90.4% |
The decay runs on the people with history enough for the year gap, 469 of the 636 and 261 of the 352, with top-1 among those people. On the third set the learned fingerprint's top-1 fell from 64.0% to 29.5% over the year, three sentences in a lineup lost 15 points, and three sentences' top-1 fell from 16.7% to 8.3%. The artist list lost six and a half points on both sets.
8.6 What I got wrong about the bar
The two claims about joint selection were paired comparisons on the same people, and both held; the top-1 gain was 5.1 points against 6.6 in exploration. The claim about a level failed. Across the sets three sentences chosen by round 2's or round 3's rule have scored between 61.5% and 75.2% in a lineup of five, depending on the rule and on who was drawn. Both rules lost about the same amount on the third set, which points to the draw more than to overfitting, but one run can't separate the two.
I pinned the bar's interval condition to round 2's 67.5%, a measurement on a different draw of people, so the bar tested the population as much as the method. Next time I would make the paired difference on the same lineups the primary test and report levels with their spread across draws.
9Discussion
A product that prints a few lines about how someone listens can be held to a number with this test. Across my sets, three sentences chosen by round 2's or round 3's rule found the reader in a lineup of five between about three times in five and three in four, and horoscope sentences about one time in three. The test is cheap to run before a feature ships, and it doesn't depend on how the reader feels about the text. The decay results suggest a card should say what period it describes, and should prefer thresholds the person clears with room to spare, which is what the hold probability does.
Joint selection is the result that replicated, and nothing in it is specific to music. Picking descriptors one at a time by rarity tends to pick several that say the same thing. Any system that summarises a person in a few lines, including the language-model profiles of Radlinski et al. (2022), Ramos et al. (2024) and Sguerra et al. (2025), could choose them against an explicit objective in the same way.
On privacy, readable summaries that name nothing are often treated as harmless. Here three sentences single out about one person in seven among a few hundred, and all 57 readable measures 42% to 50%, against Creţu et al.'s 52% among 40,000 for a learned profile. The populations here are small. The result fits what Olejnik et al. (2012) found for category-level browsing, and the conclusion of Creţu et al. that re-pseudonymised behavioural data remains personal data. The behavioural fingerprint does fade fast, halving its top-1 in a year while the artist list barely moves. Would the same hold for a general population? I don't know. That would need a Rocher-style model and a lot more people.
9.1 Limits
The population is one platform's, found by a walk over taste similarity, and many of its users keep careful logs. Measures that depend on logging, repeats and sessions especially, would look different on a streaming service's own data, which also has the skips, time zones and play lengths this data lacks. Some of the most striking statements belong to odd accounts, such as one that logs music on 1.4% of days over 14 years and one with 99% of plays in the same four hours. I kept them, because removing accounts by hand after looking would be worse. Halves differ in length from months to years, and the decay curve does not separate drift from life events of the kind Kim, Askin and Evans (2024) link to exploration. The 1-of- tests run at in the hundreds; a test at tens of thousands on the public dumps is the obvious next step. No person has seen a card. Whether a sentence that identifies its reader also feels like a description of them, and whether strangers can match people to cards, needs a study with people in it, along the lines of Sguerra et al. (2025) and Hirschprung and Leshman (2021).
Figures
All are in paper/figures/, drawn by make_figures.py from the CSVs in py/docs/.
Reproducing
The code is public at github.com/ubmids/aas, with the identity round in
py/src/aas/statements/identity.py and py/scripts/run_identity.py and data collection in
bench/lbusers/. The pre-registrations are in py/docs/statements.md and py/docs/identity.md, each
committed before its data was measured. Every round 3 number is in py/docs/identity_results.json.
References
Anderson, Gil, Gibson, Wolf, Shapiro, Semerci and Greenberg (2021). "Just the Way You Are": Linking Music Listening on Spotify and Personality. Social Psychological and Personality Science 12(4), 561 to 572. https://doi.org/10.1177/1948550620923228
Calandrino, Kilzer, Narayanan, Felten and Shmatikov (2011). "You Might Also Like:" Privacy Risks of Collaborative Filtering. IEEE Symposium on Security and Privacy 2011. https://www.ieee-security.org/TC/SP2011/PAPERS/2011/paper015.pdf
Creţu, Monti, Marrone, Dong, Bronstein and de Montjoye (2022). Interaction data are identifiable even across long periods of time. Nature Communications 13, 313. https://doi.org/10.1038/s41467-021-27714-6
Dale and Reiter (1995). Computational Interpretations of the Gricean Maxims in the Generation of Referring Expressions. Cognitive Science 19(2), 233 to 263. https://arxiv.org/abs/cmp-lg/9504020
de Montjoye, Hidalgo, Verleysen and Blondel (2013). Unique in the Crowd: The privacy bounds of human mobility. Scientific Reports 3, 1376. https://doi.org/10.1038/srep01376
de Montjoye, Radaelli, Singh and Pentland (2015). Unique in the shopping mall: On the reidentifiability of credit card metadata. Science 347(6221), 536 to 539. https://doi.org/10.1126/science.1256297
Dickson and Kelly (1985). The "Barnum effect" in personality assessment: a review of the literature. Psychological Reports 57(2), 367 to 382. https://doi.org/10.2466/pr0.1985.57.2.367
Eckersley (2010). How Unique Is Your Web Browser? Privacy Enhancing Technologies Symposium 2010, LNCS 6205. https://link.springer.com/chapter/10.1007/978-3-642-14527-8_1
Forer (1949). The fallacy of personal validation: a classroom demonstration of gullibility. Journal of Abnormal and Social Psychology 44(1), 118 to 123. https://doi.org/10.1037/h0059240
Golle (2006). Revisiting the Uniqueness of Simple Demographics in the US Population. ACM Workshop on Privacy in the Electronic Society. https://crypto.stanford.edu/~pgolle/papers/census.html
Hirschprung and Leshman (2021). Privacy disclosure by de-anonymization using music preferences and selections. Telematics and Informatics 59, 101564. https://doi.org/10.1016/j.tele.2021.101564
Kim, Askin and Evans (2024). Disrupted routines anticipate musical exploration. PNAS 121(6), e2306549121. https://doi.org/10.1073/pnas.2306549121
Matrosova, Moussallam, Louail and Bodini (2024). Depict or Discern? Fingerprinting Musical Taste from Explicit Preferences. Transactions of the International Society for Music Information Retrieval 7(1), 15 to 29. https://doi.org/10.5334/tismir.158
Mok, Way, Maystre and Anderson (2022). The Dynamics of Exploration on Spotify. ICWSM 2022. https://www.cs.toronto.edu/~ashton/pubs/spotify-exploration-dynamics-icwsm2022.pdf
Motwani and Xu (2008). Efficient Algorithms for Masking and Finding Quasi-Identifiers. SIAM SDM Workshop on Practical Privacy-Preserving Data Mining (P3DM 2008). https://crypto.stanford.edu/portia/pubs/articles/MX1363903499.html
Narayanan and Shmatikov (2008). Robust De-anonymization of Large Sparse Datasets. IEEE Symposium on Security and Privacy 2008, 111 to 125. https://doi.org/10.1109/SP.2008.33
Olejnik, Castelluccia and Janc (2012). Why Johnny Can't Browse in Peace: On the Uniqueness of Web Browsing History Patterns. HotPETs 2012. https://www.petsymposium.org/2012/papers/hotpets12-4-johnny.pdf
Oliveira, Yang, Griffiths, Bonnay and Kulshrestha (2023). Browsing behavior exposes identities on the Web. arXiv:2312.15489. https://arxiv.org/abs/2312.15489
Park, Thom, Mennicken, Cramer and Macy (2019). Global music streaming data reveal diurnal and seasonal patterns of affective preference. Nature Human Behaviour 3, 230 to 236. https://doi.org/10.1038/s41562-018-0508-z
Radlinski, Balog, Diaz, Dixon and Wedin (2022). On Natural Language User Profiles for Transparent and Scrutable Recommendation. SIGIR 2022. https://arxiv.org/abs/2205.09403
Ramos, Rahmani, Wang, Fu and Lipani (2024). Transparent and Scrutable Recommendations Using Natural Language User Profiles. ACL 2024, 13971 to 13984. https://doi.org/10.18653/v1/2024.acl-long.753
Rocher, Hendrickx and de Montjoye (2019). Estimating the success of re-identifications in incomplete datasets using generative models. Nature Communications 10, 3069. https://doi.org/10.1038/s41467-019-10933-3
Schedl (2016). The LFM-1b Dataset for Music Retrieval and Recommendation. ACM International Conference on Multimedia Retrieval (ICMR) 2016, 103 to 110. https://doi.org/10.1145/2911996.2912004
Sekara, Alessandretti, Mones and Jonsson (2021). Temporal and cultural limits of privacy in smartphone app usage. Scientific Reports 11, 3861. https://doi.org/10.1038/s41598-021-82294-1
Sguerra, Epure, Lee and Moussallam (2025). Biases in LLM-Generated Musical Taste Profiles for Recommendation. RecSys 2025. https://arxiv.org/abs/2507.16708
Staab, Vero, Balunović and Vechev (2024). Beyond Memorization: Violating Privacy via Inference with Large Language Models. ICLR 2024. https://arxiv.org/abs/2310.07298
Suwanaposee, Gutwin, Chen and Cockburn (2023). "Specially For You": Examining the Barnum Effect's Influence on the Perceived Quality of System Recommendations. CHI 2023. https://doi.org/10.1145/3544548.3580656
Sweeney (2000). Simple Demographics Often Identify People Uniquely. Carnegie Mellon University, Data Privacy Working Paper 3. https://dataprivacylab.org/projects/identifiability/paper1.pdf
Vigliensoni and Fujinaga (2017). The Music Listening Histories Dataset. ISMIR 2017. https://archives.ismir.net/ismir2017/paper/000180.pdf